Posts about Family

Spooky Consistency! 🎃🎃
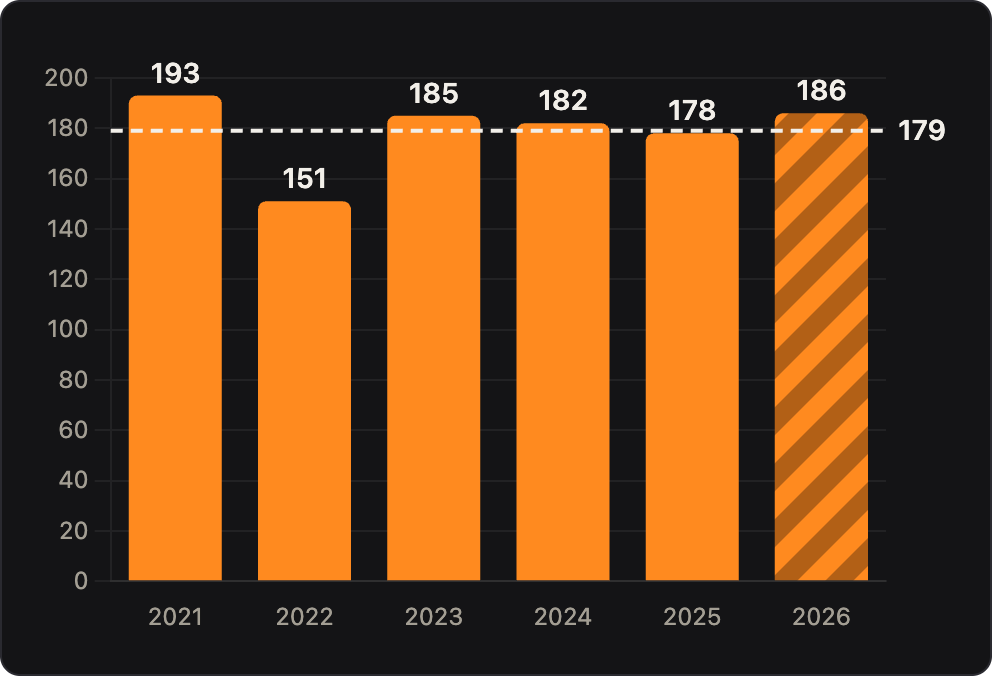
Chart of Halloween trick-or-treaters after COVID

Halloween 2026 is in the books now. We had 186 trick-or-treaters on Saturday night. A very respectable showing and a lovely evening.

What's surprising to me, year over year, is how consistent our count is, at least for the past six years. It's not like it's always the same families, or that our neighborhood is stuck. We're seeing a ton of new young families in The Willows, which makes it all the more surprising that it doesn't move the numbers much.

Well, at least since COVID. We did have some banner years, including about 2x our current amount in the nutty year of 2012. That year was nuts. This is the whole history so far.
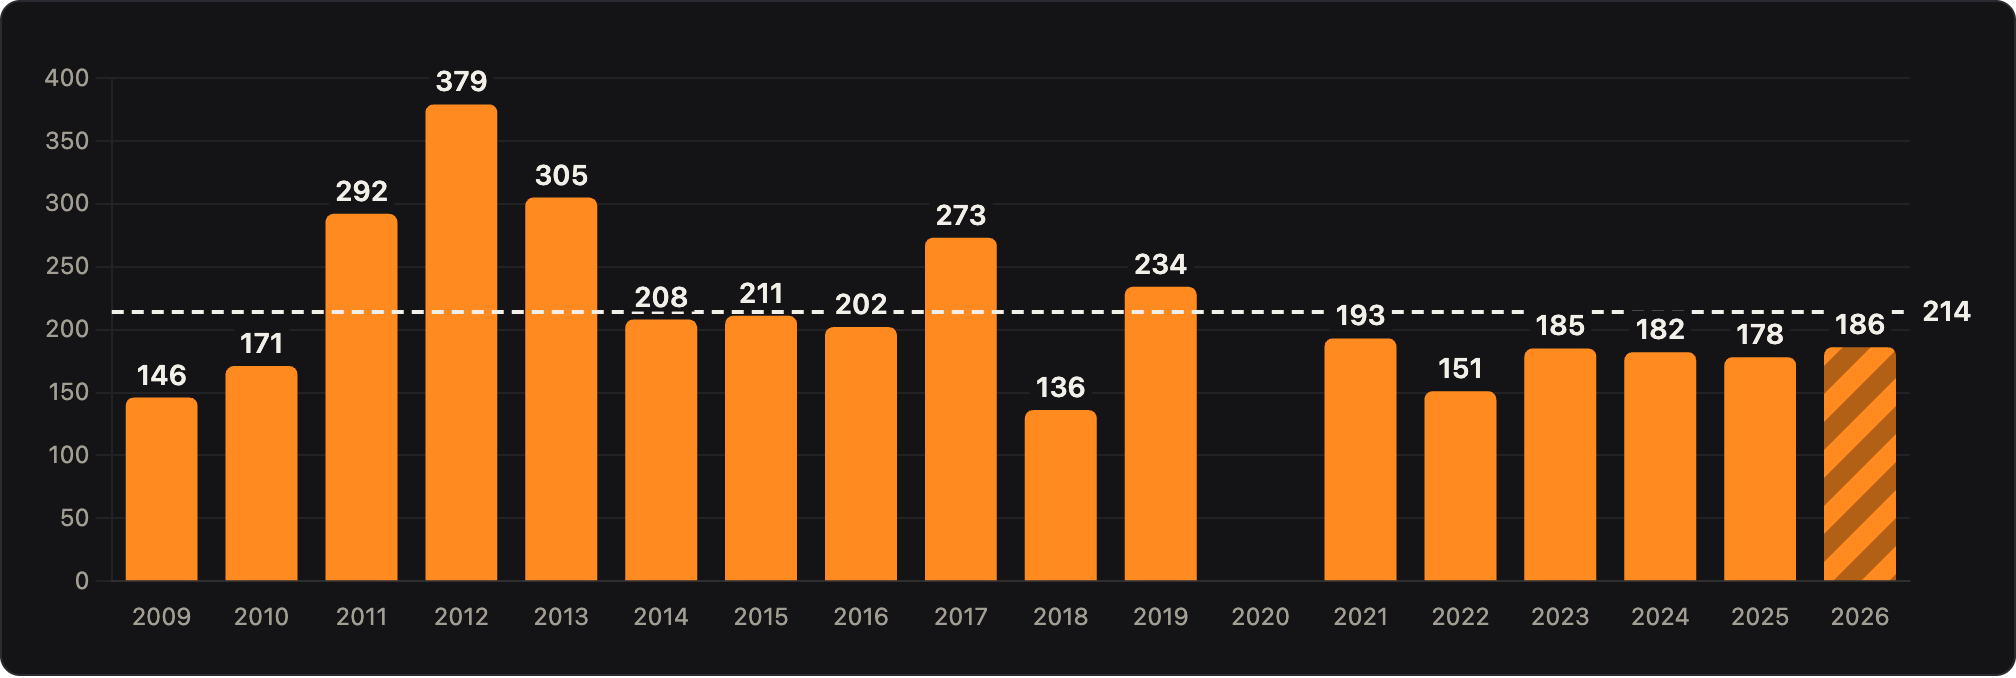
Chart of Halloween trick-or-treaters every year since 2009, averaging 214

New This Year: Live Tracking!

The big new thing this year was an app. You can try it out for yourself at halloween.kloninger.com. What you see if you go there now are some charts showing trends, but during the night-of, when we were doing the count, the live page was up showing the current tally. People have been asking me for that for years.

Here are a couple of screenshots of what it looked like on mobile. The guestbook and little "throwing pumpkins" interaction was fun.
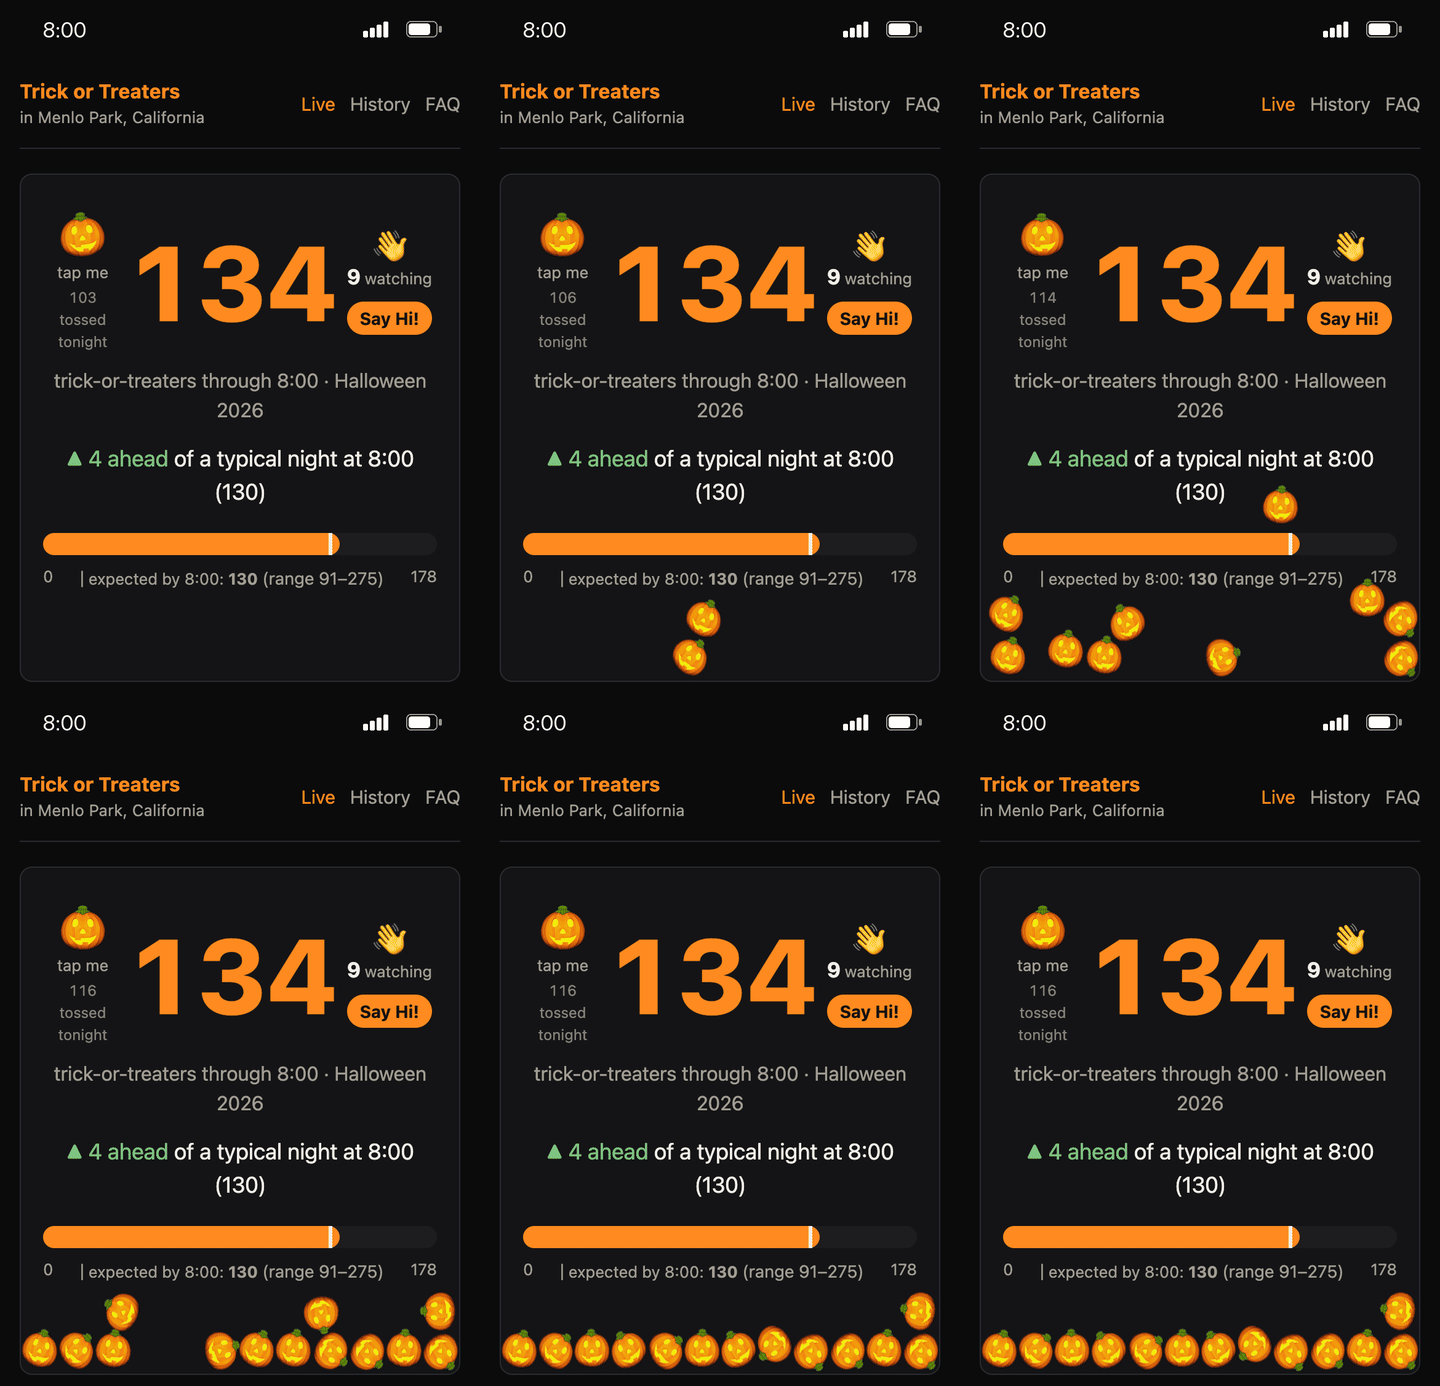
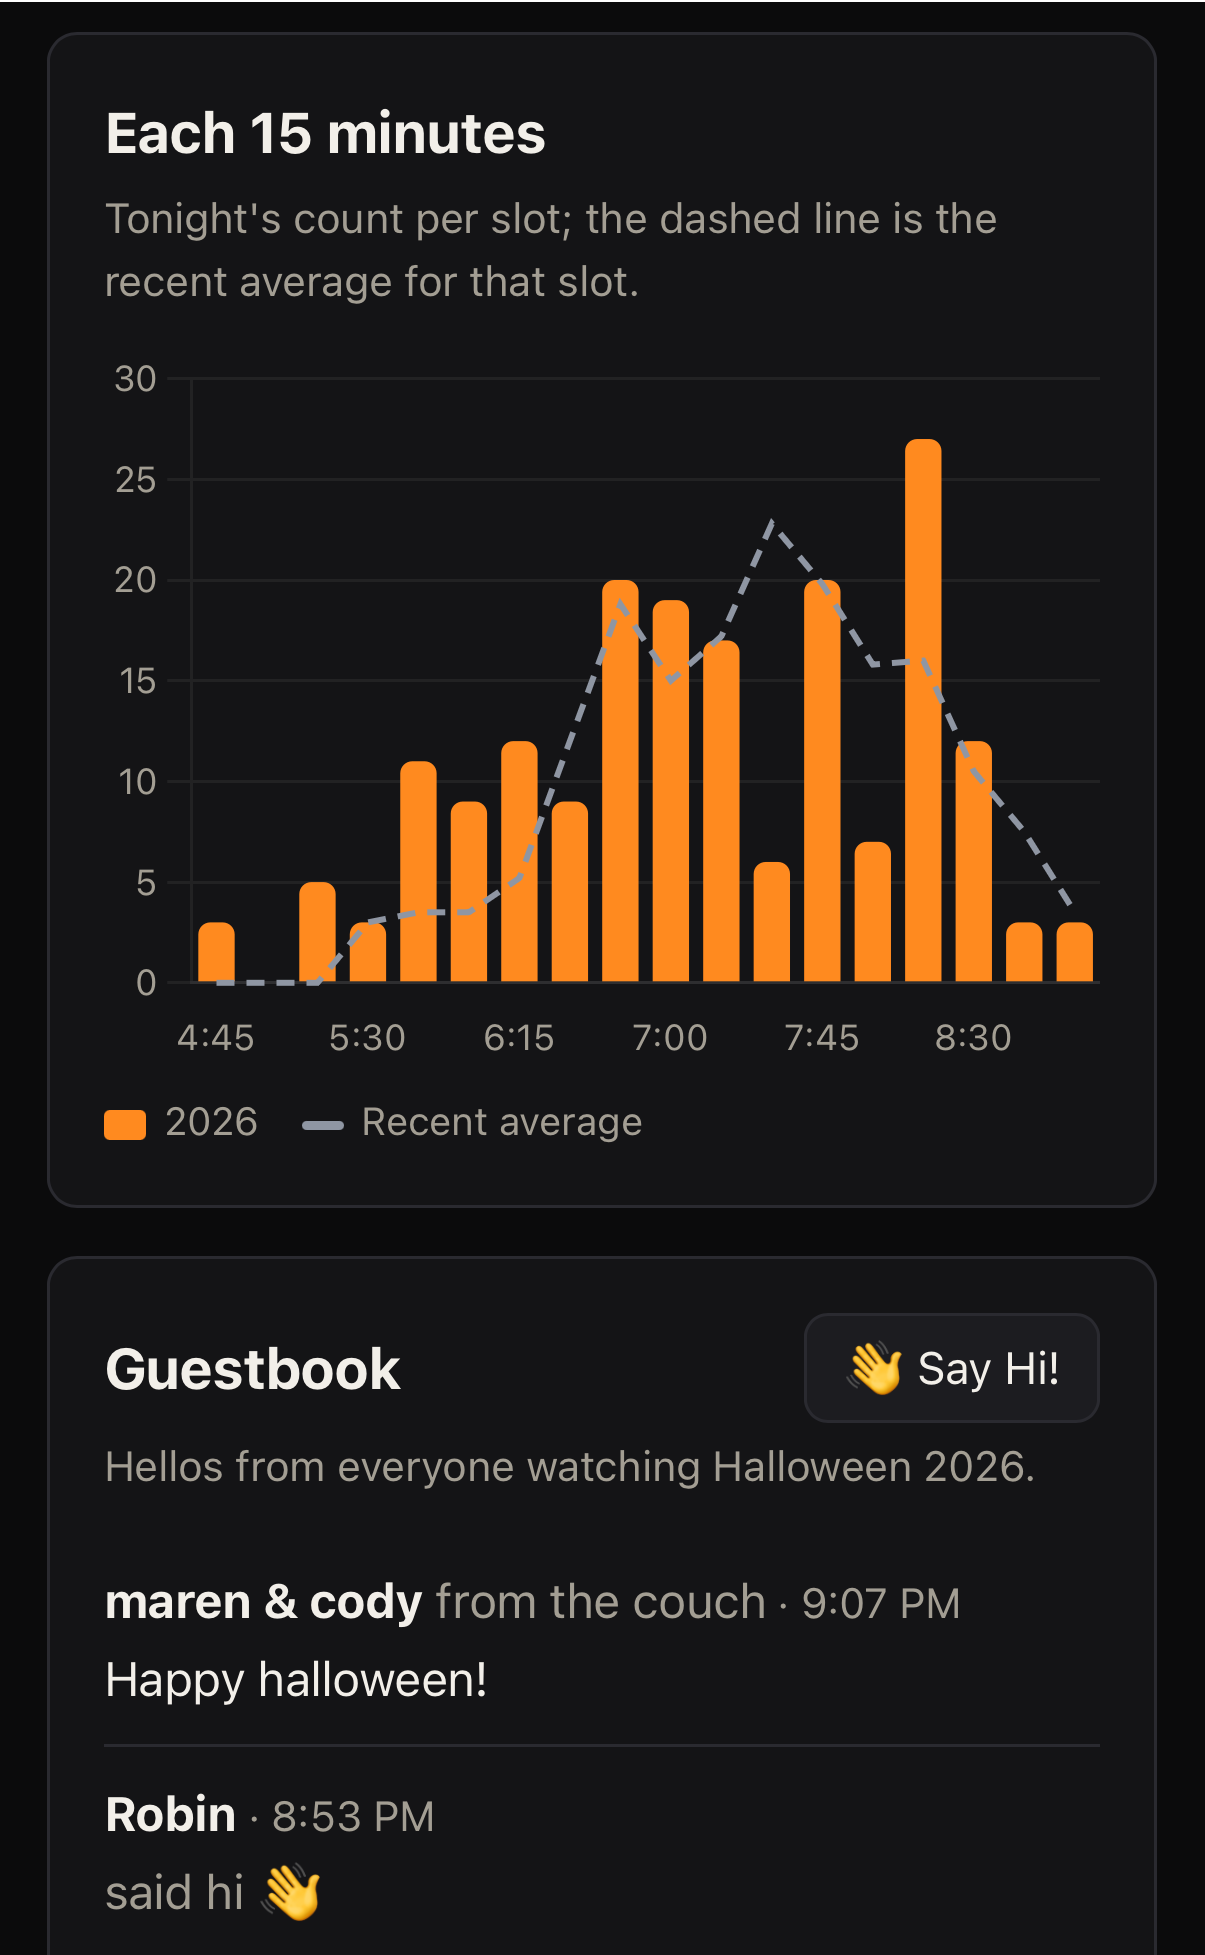
Animation: jack-o-lanterns tossed onto the live page at 8pm on Halloween night, piling up at the bottomThe live page later that night: trick-or-treaters each 15 minutes, and the guestbook

There are a bunch of other charts up there too. I especially like the heat map, check that out.

I don't plan on maintaining the old Google Spreadsheet version anymore. It had a good run, but this is way more fun.

The NY Times Bee Puzzle

How many different New York Times Spelling Bee puzzles are there? Or more precisely, how many combinations of seven letters can be used to build Bee-type puzzles?

It turns out 7,742 different seven letter combinations can be used to generate Bee-style puzzles. There are more puzzles themselves based on what letter is chosen for the middle spot.

The majority of letter choices, about 62%, have just one pangram. That's lower than I expected, actually. It's not that uncommon to have two or three pangrams, which happens about 25% of the time, and nearly four out of ten puzzles will have more than one pangram. The full output is here, the output of this program.

Watch out for the combination einprst. If this one ever comes up, good luck finding all twenty-seven of its pangrams.

The Bee Puzzle

Example Times Bee Puzzle

A Bee puzzle has seven letters with one "special" letter in the middle. Make as many words as You can find with at least four letters, using only the letters given, but it has to use the center letter. Proper nouns aren't allowed. Every puzzle has at least one pangram, a word that uses all letters — this example's is amphibian. Wikipedia cites Frank Longo as the Bee's creator.

nytbee.com has more today's puzzle and some interesting stats about these puzzles in general. They don't seem to be affiliated with the NY Times but that seem to be OK and it's a nice site.

Flat

Trick-or-treaters volume at our Menlo Park house this Halloween was basically flat compared to last year. Last year we had 208 trick-or-treaters, this year 211. We remain down quite a bit from our 2012 peak. Maybe this is the new norm?

Everything happened later this year. Our first trick-or-treater didn't show up until 6:30, and peak wasn't until 8:45. That's thirty minutes or more later than prior years. I speculate it's because it was a warm weekend night. Why not stay out a bit later, no school tomorrow. And with the fall-back DST change everyone would be looking forward to a "free" hour of sleep.

As usual, the full story can be seen in the numbers. Check it out!

Fewer Trick or Treaters This Year

This year's Halloween tally was 208. I don't know why we have 32% fewer trick-or-treaters than we had last year, which was down 20% from the year before that. Maybe the rain earlier in the day kept people home. Maybe because it was Friday people opted for parties instead of going door to door. I don't know.

Thanks to my friend Stuart for being on this year's data gathering crew. As usual, the full story is in the numbers.

In Praise of the Hand Tally

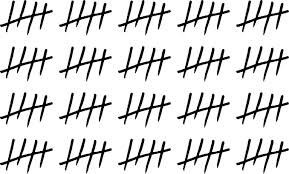
Tally Marks

For the past five years I've gathered statistics on how many trick-or-treaters have come by on Halloween. If you want to read about that, check out posts from last year or the year before. This post is about how I track those stats, and how I don't.

Every year I'm tempted to build some fancy system to collect and manage these statistics. Wouldn't it be fun, say, to wire up some Raspberry Pi sensor that automatically counts and tweets running totals? It wouldn't be that hard and sounds like fun.

The problem is making something like that reliable. You'd have to do all the un-fun stuff, like testing and contingency planning. If your baseline is a clipboard, paper, and a ball point pen, your bar for failure is basically "never". Even if I did build something fancy I'd still end up doing backup tallies by hand. At this human scale, the tech ends up being a fun gimmick, not required.

It reminds me of a story from friend [Tony]. Tony and his brother Tom run a giant gaming convention every year, the Evolution Championship Series (Evo for short). It's a multi-day convention in Las Vegas that attracts something like ten thousand participants. They run the whole thing with their two other founders and some friends — I'm sure they have some paid help now, but the four guys are the main ones. It's impressive.

Given that Tony and Tom are strong engineers, I figured this would be a slick high-tech operation. Not so.

Tony said they've tried tech at various points and it wasn't worth it. It's easy to see why that is tempting: they have multiple mobile coordinators that need access to changing, shared information, like brackets and schedules. But what they've tried has let them down. Usually it's not the hard parts that fail, but the basics, like batteries and wireless connectivity. So they still run this off of printouts and voice communications (cell phones/walkie-talkies) and periodic data dumps.

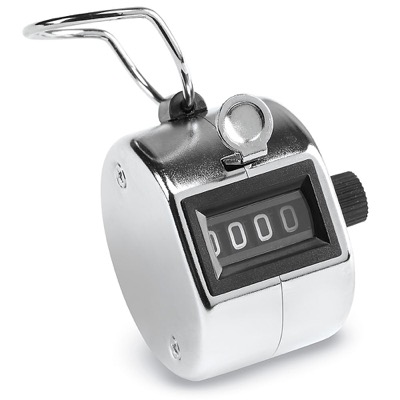
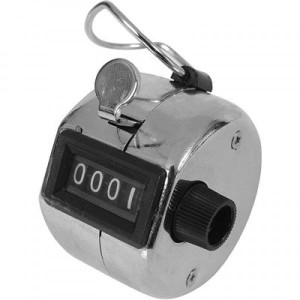
Chrome hand-held tally counter with a four-digit display

And so, this year I'll be gathering my Halloween stats like I always have: clipboard, pen, and a hand-held tally counter. The data will still be timely and accurate.

For the curious few, check out my Halloween Traffic Spreadsheet.

Two postscripts. First, Please stop spreading that NASA Space Pen story. I'm sure you've heard it: how do you write in zero G? the wasteful Americans commissioned a multi-million dollar space pen project; the scrappy can-do Russians used pencils. Well, this story has been debunked by the good people at Snopes.

And second, I'd like to plug Tony and Tom's "day job", Stonehearth. I think of it as Starcraft meets Minecraft. I am so eager to play it when it lands.

Chicken Soup

Yummy Bowl of Chicken Noodle Soup

My family hasn't avoided the colds that are going around now. My way of fighting back is making chicken noodle soup. It's not too hard, it's satisfying, and it tastes great. The recipe belongs to Peninsula School and gets used at our annual Craft Fair. It's benefited from years of refinement.

I add more salt. I don't do peas. I've tried with rice but it got starchy and weird, stick with egg noodles.

Halloween Down 20%, But Still Solid

halloween2013-ticker

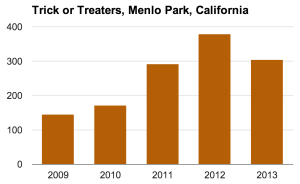
This year we had a sizable number of trick-or-treaters at our house in the Willows neighborhood of Menlo Park. The 303 we saw was down from our high last year, but about the same as the year before that.

So here are the totals:

halloween2013-total

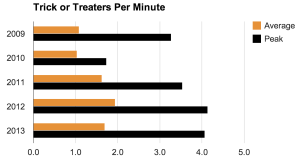
The rate at peak was comparable to last year.

halloween2013-rate          halloween2013-cumulative

I don't have an explanation why we are down a bit. The weather was beautiful, indeed a little better than last year since rain started at 8:30 last year. Maybe the forecast rain coming last year got people out earlier who might have missed altogether?

It was outstanding having my friend Amy LaMeyer helping out. She operated the clicker that was new this year, and so kept me company, which was a ton of fun.

As always, the Google Spreadsheet with the graphs and raw data is publicly available here. Check it out!

Halloween Candy Data

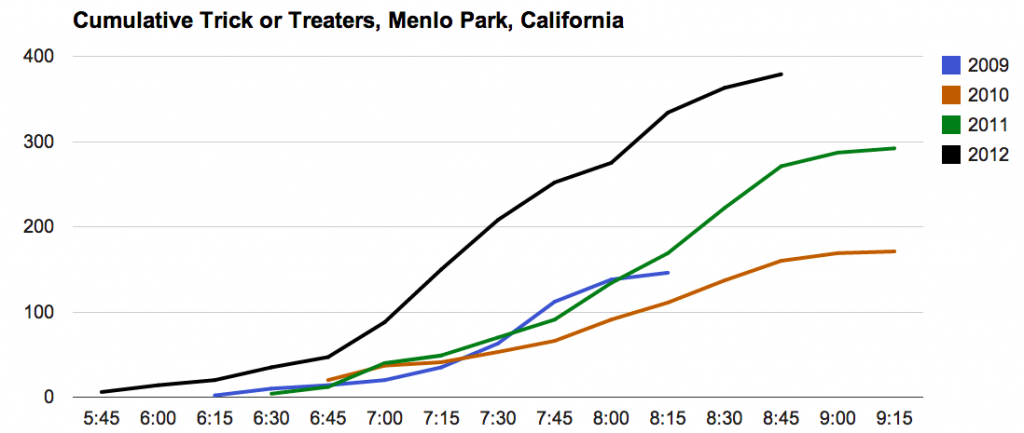
Update with actuals from Halloween 2012:  It was a banner year.

halloween-2012


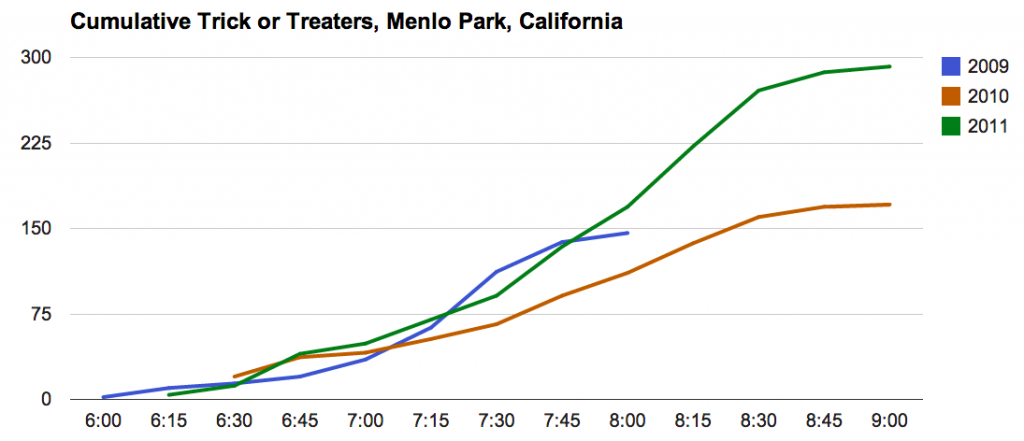
You may be giving out candy later today. What can you expect? Let's look at some data.  This post summarizes the past three Halloweens.

Cumulative Trick or Treaters

As you can see we live in a pretty popular neighborhood.  Each year has its own story.

  • 2009 - our first year in our new neighborhood. We had no idea that this was such a popular trick-or-treating spot. I ran out of candy at 8:00, turned out the lights, and hid in the back of the house. Shameful.
  • 2010 - a fine year.  No complaints.
  • 2011 - we moved to a new house just around the corner.  I figured the quieter street would mean fewer kids -- not so! What I didn't appreciate was the attractive power of my next door neighbor's insane decorations. Luckily my wife came back with emergency supplies just in time.

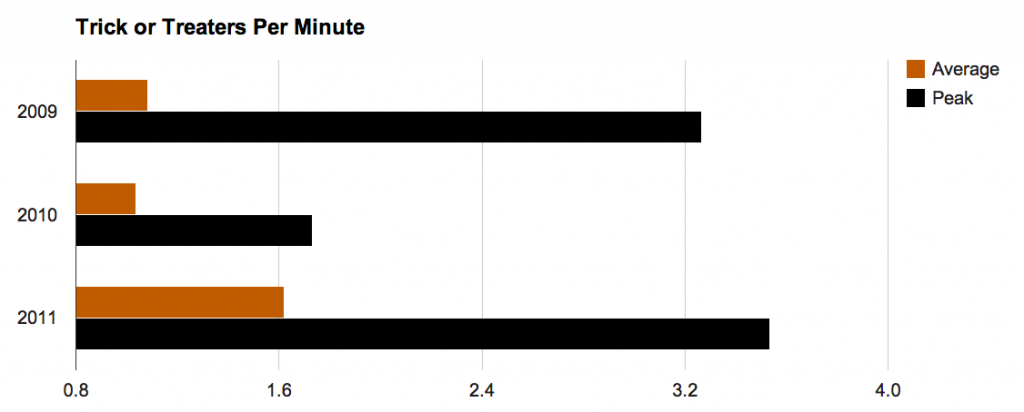
And how busy do things get?  Darn busy.

Average and Max Trick or Treaters per Minute

During the busiest 15 minute period last year I was serving a kid every twenty seconds or so.  When bursting this is close to my max current candy-dispensing throughput.

If you come by my house this year you'll see me again, handing out candy with one hand and scribbling hash marks with the other.   I'll update the data in my public spreadsheet.