Posts about Data

Big Local News

Big Local News

Lately I've been a volunteer contributor to the Big Local News project at Stanford. In my next post I'll describe what I've been doing — I think it's interesting. But this post is about the people and the project, which has been the best part.

Why Journalism? Why Journalists?

I didn't go looking to be part of journalism. It's not something I've ever done, not really even something I've aspired to. I didn't write for my high school paper. Intermittent posts to this blog are the most writing I've done in a long time. This blog is proof that I'm not much of a writer and I'm certainly not an investigator.

What I've come to understand is that writing is only a part of the journalist's job, maybe not even the most important part. Sure, you have to know structure and grammar, and know how to present complex ideas in a cogent way. But look at how Britannica defines journalism:

Journalism is the collection, preparation, and distribution of news and information to the public. Embedded in the idea of journalism is the notion that it exists to inform the public and hold the powerful to account.

There are a lot of verbs in there, none of which are "writing" or "editing."

These days the journalist's job seems to be as much about data as the traditional parts of the job: working the phones, cultivating sources, and shoe-leather chasing down leads. Journalists are now expected to know how to get data, evaluate it, and analyze it to pull out insights. Aside from the purely narrative stories, most stories are built on foundations of insightful data.

Indeed, if you read the FAQ at the Stanford Master's in Journalism program page, when someone asks "I'm a writer but I don't know how to program, is this program a fit for me?" the answer is "we'll teach you." I think that's pretty common in the field these days. But it's also a tall order. Some journalists want to be data engineers too, but some don't.

Back to the definition: "collection, preparation, and distribution" of news sounds like data science to me. But also read that second part, about "informing the public" and "holding the powerful to account." Good stuff, right? Journalists (at least the ones I've been working with lately) bring a sense of mission to the job. Sure, it's work, it's of civic importance, and there's pride in the craft. But what they seem to enjoy the most is speaking truth to power. They're troublemakers.

Big Local News

I found my way to the Big Local team through my friend Hannah. She's a librarian at Stanford. She introduced me to Cheryl Phillips, the director and program founder, and we met over coffee. We hit it off.

Two things impressed me. First, the mission. Big Local News uses technology to bend the cost curve for local journalism — make local news cheaper. I'll say a little more about why that resonates with me below. But I believe local news is worth fighting for, and I like how BLN is doing it. Trying to fix the demand side of the news business model feels really hard, swimming against a lot of currents — more readers! more exciting stuff! I think Big Local News, by taking on a supply-side fix, is taking a novel and more scalable approach.

Second, I really liked the BLN team. They are muckrakers and do-gooders, exactly the kind of mission-driven people I described above. Sure, they also have good technical chops and I enjoy doing tech stuff with them. But first and foremost they're journalists. Most have worked a beat or spent time in a newsroom. They know the domain, and they know what problems local news organizations actually have. So I have some confidence that if we build this stuff, it'll reach the local news outlets that need it. It's also important that they are bright, nice people.

After meeting the team and going to a conference I got to work (more on the project coming soon). For the past three months I've worked as a member of the team. They've welcomed me into their meetings. I sit with them in the McClatchy building on the Stanford campus, I'm in the Slack, and I went to their year-end party. It's nice to be affiliated with these folks. I like having an excuse to hang out with some troublemakers.

Last week I was proud to be added to the team "about" page — scroll down to the "Collaborators" section. 😀

Motivation

I think everyone's aware of the decline of the business model behind local news over the past twenty-some years. It's gone from bad to worse. A couple of examples.

In some places, like the Bay Area Peninsula where I live, local papers banded together as a nonprofit, Embarcadero Media, on the theory that they are a public good (which they are). Being a 501(c)(3) enables charitable giving to fill in gaps left when classified ads and subscriptions dried up. That's a fine solution to the problem — honest, and probably useful — but I think that might only work in wealthy places like here.

Not so much for Fresno, where I'm from. My mom and dad still both live there (separately) and each gets the daily paper. Both bemoan the slow decline of the Fresno Bee: the print version that Mom wants is down to three days a week and upward of $500/year to have delivered to your door. That's just too much, so Dad takes the SF Chronicle, a good paper but not local. Without news about your community, is it any surprise that people feel less connected to and invested in where they live? And yes, the mundane things like weather and high school sports do matter.

What's a place like Fresno to do? I recently came across Fresnoland, which looks to be doing some good reporting. They're structured as a nonprofit, like Embarcadero, and they've gotten good donors. I hope that's keeping the lights on! I see two members on their staff for whom Report for America pays half their salary — that seems like a cause worth supporting. Maybe it's presumptuous, but I imagine Fresnoland might need some help with the data science. They're exactly the kind of team that Big Local News is aiming to help.

I think having better, shared news is one part of healing the divisions in this country. If I can help with a little bit of that, it's worth doing.

Data Is Worth Preserving

Logo for the Data Rescue Project

Governments should produce public goods, like navigation aids and roads. That seems like a reasonable thing to expect of a functioning government, right?

I consider data a public good too. We all benefit from accurate maps, thorough measurements of the natural world, and trustworthy economic data.

Which is why I was so upset when I heard how the current US administration has been on a tear to actually remove data. All through 2025, websites were taking down and datasets were taken offline. This Wikipedia page catalogs what's been happening, and this report by the American Statistical Association goes into more depth about what's been happening and its implications.

In response the Data Rescue Project sprang into action. They're a group of concerned academics, librarians, and citizens who have been copying and cataloging datasets so they aren't lost. The project's press page has links to many articles and presentations that describe their work and its impact. Last November I saw a call for volunteers for DRP on a mailing list of ex-Googlers and was eager to help.

Homeland Infrastructure Foundation-Level Data (HIFLD)

It's worth describing a bit about the particular dataset I actually worked on: Homeland Infrastructure Foundation-Level Data (HIFLD). It's a good case study.

HIFLD is a collection of maps. Maps of basic stuff, like roads, levees, river depth charts, locations of military bases. Beyond just being good maps, a big part of HIFLD's value is helping to make sure everyone uses the same maps.

So HIFLD is mostly curating data. Most of the data comes from other agencies (USGS, Army Corps of Engineers, Census Bureau) and HIFLD brings it together and provides it in a trustworthy, central place. Well, I should say "provided" because in September the government stopped providing it. The story is well told in this good article on Project Geospatial.

This is where the Data Rescue Project comes in. DRP volunteers immediately scooped up the data and kept in temporary storage. Then they organized a bucket brigade of volunteers to categorize and put snapshots into long-term storage. Importantly, this was coupled with metadata to ensure they're findable later. That's the part I worked on, uploading and entering metadata. We met our goal of getting all of HIFLD "rescued" by year's end. Frank Donnelly, the project manager, wrote up a nice summary of what we did and how. For my piece I relied on a nice Selenium driver, written by another volunteer, to create over a hundred projects (screen recording).

This is just one of many DRP efforts. Check out their tracker to see the breadth of work.

While I'm proud of this project, I keep reminding myself that we're playing defense. Having a one-time snapshot isn't nearly as good as having the government actually do its job. Which is why we need to keep demanding better leadership and a return to effective government. Assert your rights and protest!   ❌ 👑.


Post-Publish Updates

I'll update this section from time to time with updates and press on this project.

Learn From Experiments

Line art of an experiment

What's the value of an experiment or a prototype?

There are all kinds of ways to have impact. A feature can improve user experience; a hardening project can reduce risk of a production outage; refactoring or test coverage can improve velocity or make software easier and safer to maintain. And good engineers care a lot about impact. While it's not the only thing that matters (the "how" is important too), if you start with impact, you'll generally do well.

An engineer's job is to put ideas into practice, to make things. But sometimes we're not sure what to make. Or we think we know, but aren't sure it'll work. The best way to figure that out is often running a set of experiments, or maybe building a prototype (an n=1 experiment).

But crucially, an experiment doesn't have value itself. An experiment is successful only if we've learned something. The intent of the test rig or prototype isn't to live on. Indeed, knowing that we plan to throw it away is part of what makes it fast and cheap to build, and it shouldn't have all the trappings of production-quality software, like test coverage and code reviews.

So how do we ensure that value gets delivered? When you work in a team or a company people turn over. It's not just enough to do the experiment, you need to write it up and share your results. To produce a good writeup, you should:

  1. Figure out the hypothesis(es) you're testing. Often this is in the form of one or more questions. For prototypes, it might be a boolean, i.e. we can build X that will work. But even then, consider what "done" means. Stating your hypothesis in terms of a metric is often easiest. NB I find the goal/driver/guardrail framework from Thanks Diane's book helpful, Trustworthy Online Controlled Experiments.

  2. State your assumptions and method. This is where you usually get the most feedback. Note that this usually isn't a project plan, as your reviewers usually don't care how long it takes or what happens when.

  3. Seek feedback from your peers. Publish the doc stating the method to have smart people poke holes in your plan and make sure what you're measuring will actually address the hypothesis. And then when the experiment is done, get it reviewed by someone senior to ensure that your work supports your conclusion. This also spreads knowledge about this work (both that you're doing it, and the results) so the overall organization benefits.

The artifact produced has many benefits. It's useful for you as you discuss follow-on work; it's useful come performance evaluation time. But most importantly, it benefits the organization. Contemporary and future peers can learn from this work.

You'll benefit from taking the time to write it up, the reviewers learn from reading, and it'll live on past your time with the team.

Flat

Trick-or-treaters volume at our Menlo Park house this Halloween was basically flat compared to last year. Last year we had 208 trick-or-treaters, this year 211. We remain down quite a bit from our 2012 peak. Maybe this is the new norm?

Everything happened later this year. Our first trick-or-treater didn't show up until 6:30, and peak wasn't until 8:45. That's thirty minutes or more later than prior years. I speculate it's because it was a warm weekend night. Why not stay out a bit later, no school tomorrow. And with the fall-back DST change everyone would be looking forward to a "free" hour of sleep.

As usual, the full story can be seen in the numbers. Check it out!

Fewer Trick or Treaters This Year

This year's Halloween tally was 208. I don't know why we have 32% fewer trick-or-treaters than we had last year, which was down 20% from the year before that. Maybe the rain earlier in the day kept people home. Maybe because it was Friday people opted for parties instead of going door to door. I don't know.

Thanks to my friend Stuart for being on this year's data gathering crew. As usual, the full story is in the numbers.

In Praise of the Hand Tally

Tally Marks

For the past five years I've gathered statistics on how many trick-or-treaters have come by on Halloween. If you want to read about that, check out posts from last year or the year before. This post is about how I track those stats, and how I don't.

Every year I'm tempted to build some fancy system to collect and manage these statistics. Wouldn't it be fun, say, to wire up some Raspberry Pi sensor that automatically counts and tweets running totals? It wouldn't be that hard and sounds like fun.

The problem is making something like that reliable. You'd have to do all the un-fun stuff, like testing and contingency planning. If your baseline is a clipboard, paper, and a ball point pen, your bar for failure is basically "never". Even if I did build something fancy I'd still end up doing backup tallies by hand. At this human scale, the tech ends up being a fun gimmick, not required.

It reminds me of a story from friend [Tony]. Tony and his brother Tom run a giant gaming convention every year, the Evolution Championship Series (Evo for short). It's a multi-day convention in Las Vegas that attracts something like ten thousand participants. They run the whole thing with their two other founders and some friends — I'm sure they have some paid help now, but the four guys are the main ones. It's impressive.

Given that Tony and Tom are strong engineers, I figured this would be a slick high-tech operation. Not so.

Tony said they've tried tech at various points and it wasn't worth it. It's easy to see why that is tempting: they have multiple mobile coordinators that need access to changing, shared information, like brackets and schedules. But what they've tried has let them down. Usually it's not the hard parts that fail, but the basics, like batteries and wireless connectivity. So they still run this off of printouts and voice communications (cell phones/walkie-talkies) and periodic data dumps.

And so, this year I'll be gathering my Halloween stats like I always have: clipboard, pen, and a hand-held tally counter. The data will still be timely and accurate.

For the curious few, check out my Halloween Traffic Spreadsheet.

Two postscripts. First, Please stop spreading that NASA Space Pen story. I'm sure you've heard it: how do you write in zero G? the wasteful Americans commissioned a multi-million dollar space pen project; the scrappy can-do Russians used pencils. Well, this story has been debunked by the good people at Snopes.

And second, I'd like to plug Tony and Tom's "day job", Stonehearth. I think of it as Starcraft meets Minecraft. I am so eager to play it when it lands.

Halloween Down 20%, But Still Solid

halloween2013-ticker

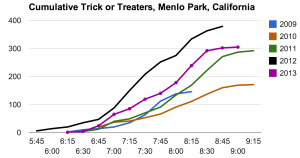
This year we had a sizable number of trick-or-treaters at our house in the Willows neighborhood of Menlo Park. The 303 we saw was down from our high last year, but about the same as the year before that.

So here are the totals:

halloween2013-total

The rate at peak was comparable to last year.

halloween2013-rate          halloween2013-cumulative

I don't have an explanation why we are down a bit. The weather was beautiful, indeed a little better than last year since rain started at 8:30 last year. Maybe the forecast rain coming last year got people out earlier who might have missed altogether?

It was outstanding having my friend Amy LaMeyer helping out. She operated the clicker that was new this year, and so kept me company, which was a ton of fun.

As always, the Google Spreadsheet with the graphs and raw data is publicly available here. Check it out!

Halloween Candy Data

Update with actuals from Halloween 2012:  It was a banner year.

halloween-2012


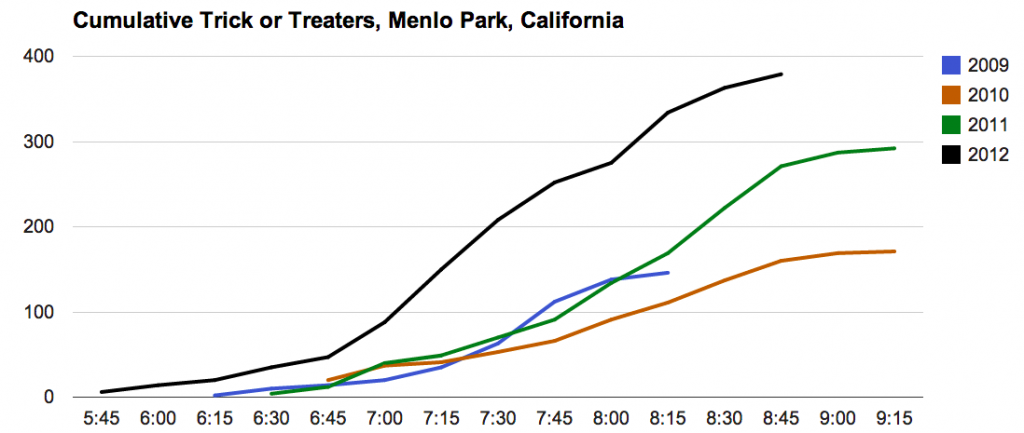
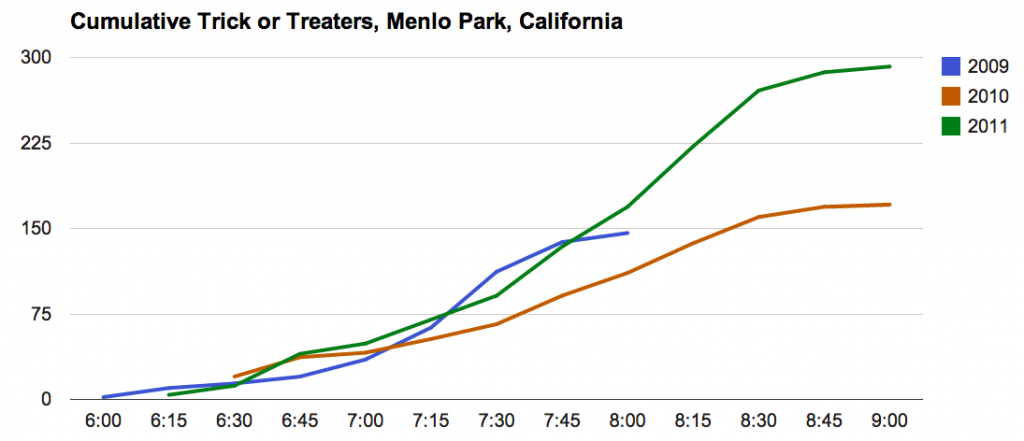
You may be giving out candy later today. What can you expect? Let's look at some data.  This post summarizes the past three Halloweens.

Cumulative Trick or Treaters

As you can see we live in a pretty popular neighborhood.  Each year has its own story.

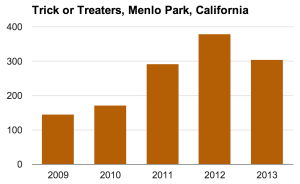
  • 2009 - our first year in our new neighborhood. We had no idea that this was such a popular trick-or-treating spot. I ran out of candy at 8:00, turned out the lights, and hid in the back of the house. Shameful.
  • 2010 - a fine year.  No complaints.
  • 2011 - we moved to a new house just around the corner.  I figured the quieter street would mean fewer kids -- not so! What I didn't appreciate was the attractive power of my next door neighbor's insane decorations. Luckily my wife came back with emergency supplies just in time.

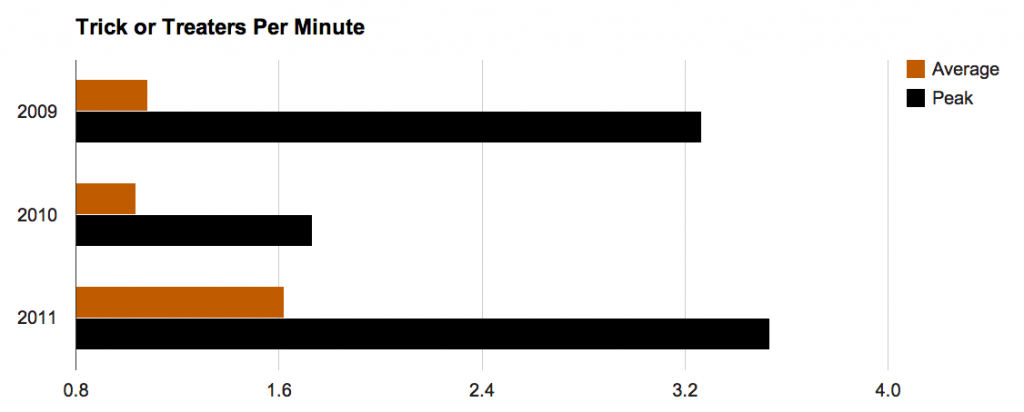
And how busy do things get?  Darn busy.

Average and Max Trick or Treaters per Minute

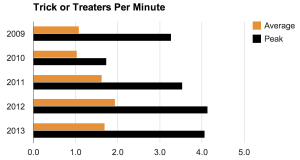
During the busiest 15 minute period last year I was serving a kid every twenty seconds or so.  When bursting this is close to my max current candy-dispensing throughput.

If you come by my house this year you'll see me again, handing out candy with one hand and scribbling hash marks with the other.   I'll update the data in my public spreadsheet.